Influxdb is a time series database. It will be used to save the information received from the telegram. Influxdb can be defined as “output” in the config file of Telegraf.
To install InfluxDB on “Ubuntu” or “Debian” operating systems, follow the steps below.
System update is done before starting the installation.
sudo apt-get
update
sudo apt-get
-y upgrade
Adding InfluxDB to the repository for “Ubuntu” users
curl -sL https://repos.influxdata.com/influxdb.key|sudo apt-key add –
OKsource
/etc/lsb-release
echo “deb https://repos.influxdata.com/${DISTRIB_ID,,} ${DISTRIB_CODENAME} stable”
|sudo tee /etc/apt/sources.list.d/influxdb.list
For Example : echo “deb https://repos.influxdata.com/ubuntu trusty stable” | sudo tee
Adding InfluxDB to the repository for “Debian” users
You can check which stable version is installed with the command “lsb_release –a”. Repository test will respond to installed version

curl -sL https://repos.influxdata.com/influxdb.key|sudo apt-key add –
source
/etc/os-release
test$VERSION_ID="7"&&echo"deb https://repos.influxdata.com/debian wheezy stable"|sudo tee /etc/apt/sources.list.d/influxdb.list
test$VERSION_ID="8"&&echo"deb https://repos.influxdata.com/debian jessie stable"|sudo tee /etc/apt/sources.list.d/influxdb.list
test$VERSION_ID="9"&&echo"deb https://repos.influxdata.com/debian stretch stable"|sudo tee /etc/apt/sources.list.d/influxdb.list
Installing and starting the InfluxDB service.
sudo apt-get update&&sudo apt-get install influxdb
sudo service influxdb start
Checking the status of the InfluxDB service
sudo service influxdb status
Restarting the InfluxDB Service
sudo service influxdb restart
Or
The necessary steps to install Influxdb in the /u01 directory are as follows.
wget https://dl.influxdata.com/influxdb/releases/influxdb2-2.1.1-linux-amd64.tar.gz
“tar xf influxdb2-2.1.1-linux-amd64.tar.gz” The file is extracted with the command.
The download file is selected according to the platform where Influxdb will be installed. We will install the “Linux Binaries(64-bit)” (into the /u01 directory)
Then rename the file to “influxdb”.
Influxdb needs “config” file to work. This config file contains the settings for influxdb. Necessary adjustments are made in the “influxdb.conf” file under the “/u01/influxdb/etc/influxdb/” directory.
For Influx db to work, “influxd” service must be running, so “infuxd” service must be started first. Run influxd with the command “/u01/influxdb/usr/bin/influxd -config /u01/influxdb/etc/influxdb/influxdb.conf”.
Shell script is run to define database to Ifluxdb.
For http connection: “/u01/influxdb/usr/bin/influx”
For https connection: “/u01/influxdb/usr/bin/influx -ssl -unsafeSsl ”
One of the commands is run. (-unsafeSsl : written for self-certificate.)
auth” for authorized login;
Editing InfluxDB Config File. (Enable https and auth mode)
Enter the config directory with “sudo nano /etc/influxdb/influxdb.conf”.
The [http] tab is reached and the following settings are made.
# Determines whether HTTP endpoint is enabled.
enabled = true
# The bind address used by the HTTP service.
bind-address = “:8086”
# Determines whether user authentication is enabled over HTTP/HTTPS.
auth-enabled = true
# Determines whether HTTP request logging is enabled.
log-enabled = true
# Determines whether HTTPS is enabled.
https-enabled = true
# The SSL certificate to use when HTTPS is enabled.
https-certificate = “/etc/ssl/influxdb-selfsigned.crt”
# Use a separate private key location.
https-private-key = “/etc/ssl/influxdb-selfsigned.key”
Go to the [subscriber] tab and make the following settings.
# Allows insecure HTTPS connections to subscribers. This is useful when testing with self-
# signed certificates.
insecure-skip-verify = true
If there is none after the settings, “https-certificate” and “https-private-key” files should be created and copied to the specified file paths.
To create Self-Signed Certificate files for https;
·         sudo openssl req -x509 -nodes -newkey rsa:2048 -keyout /etc/ssl/influxdb-selfsigned.key -out /etc/ssl/influxdb-selfsigned.crt -days <NUMBER_OF_DAYS>
• Example: A number is entered instead of <NUMBER_OF_DAYS>. like 999
• Some information will be requested while the file is being created. You can fill this information randomly.
After creating the files, make sure they are in the place we specified in the config file.
Restart influxdb with “sudo service influxdb restart” command and make sure it is running with “sudo service influxdb status” command.
With the command “influx -ssl –unsafeSsl” you can connect to influxdb from the command line.
To login with user and password;
influx –username bugra –pasword ‘admin’-ssl –unsafeSsl or
influx -ssl –unsafeSsl
auth
username: bugra
password: admin
Tanımlı kullanıcıları göstermek için;
“show users” command is used. You will get a result similar to the following.
user admin
—- —–
bugra true
test false
To define and use a new database;
“create database test “ –> test: database name
“show databases” –> to see defined databases.
“use test” –> test: database name
After these processes, we have completed the installation process of InfluxDB on the operating system and created a sample user and database. For other commands, the link given at the top of the page can be used.
TELEGRAF
Telegraf is a software that can be used to measure the usage values of hardware such as cpu, ram…etc. It also has plugin support to integrate with many platforms such as MQTT, Ifluxdb. The necessary steps to install Telegraf in the /u01 directory are as follows. (First create the u01 directory.)
https://portal.influxdata.com/downloads#telegraf
Select the “Telegraf” tab on the website.
The download file is selected according to the platform on which Telegraf will be installed. We will install the “Linux Binaries(64-bit)” (into the /u01 directory)
wget https://dl.influxdata.com/telegraf/releases/telegraf-1.21.2_linux_amd64.tar.gz
tar xf telegraf-1.21.2_linux_amd64.tar.gz


tar xf telegraf-1.21.2_linux_amd64.tar.gz ” The file is extracted with the command.
Then change the name of the file to “telegraf”.
Telegraf needs the “config” file to work. This config file contains the input and output plugins of the telegram. Input and output plugins are prepared by making necessary arrangements in the “telegraf.conf” file under the “/u01/telegraf/etc/telegraf/” directory.
Start telegraf with the help of “/u01/telegraf/usr/bin/telegraf -config /u01/telegraf/etc/telegraf/telegraf.conf” command.
To define InfluxDB to Telegraf;
urls = [“http://127.0.0.1:8086”] //influxdb address for http
urls = [“https://127.0.0.1:8086”] //influxdb address for https
database = “bugra” // influxdb database adı
username = “bugra”
password = “bugra”
insecure_skip_verify = true
GRAFANA
Grafana is an objective visualization interface. It works with many platforms such as influxdb. The steps required to install Grafana in the /u01 directory are as follows. (A detailed examination can be made at the link “http://docs.grafana.org/”).
“Standalone Linux Binaries (64Bit)” tab is selected on https://grafana.com/grafana/download “.
wget https://dl.grafana.com/enterprise/release/grafana-enterprise-8.3.4.linux-amd64.tar.gz
tar -zxvf grafana-enterprise-8.3.4.linux-amd64.tar.gz
Then change the filename to “grafana”.
Grafana needs “config” file to work.
Necessary adjustments are made in the “u01/grafana/conf/defaults.ini” file.
Go to Grafana folder (cd /u01/grafana/)
Start grafana with the command “/u01/grafana/bin/grafana-server start –config /u01/grafana/conf/defaults.ini”.
Grafana uses the “3000” port by default. To change it, edit the “default.ini” file (default port 443 for https)
Login to the interface from the address “localhost:3000”.
Default username: “admin” password is “admin”.
To make a connection as HTTPS;
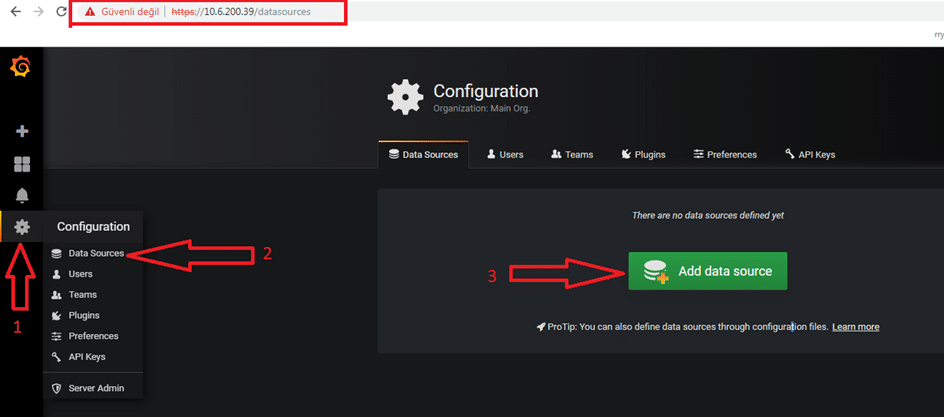
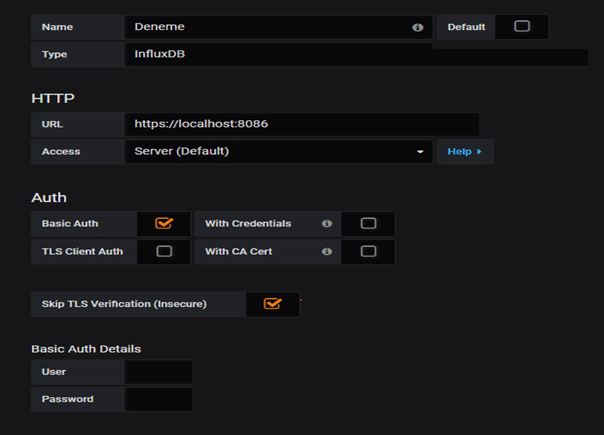
To define InfluxDB to Grafana;


Source: https://docs.influxdata.com/
Tags: